
Infographics have become all the rage with Internet lovers. They provide quick & easy factual information related to a certain topic. I have always loved the idea but never thought it would catch on so quickly. Looking over Google you can find so many examples of refined infographics on nearly any subject.
But there are also many designers who want to get into the craft. Making your own infographic is very hard work, since you’ll need to do research on topics to gather statistics & data. But if you are fairly well-versed in a subject then it is obviously worthwhile trying your hand at some different graphics. Check out these online resources and see if you can learn anything new about the art of infographic design.
Piktochart
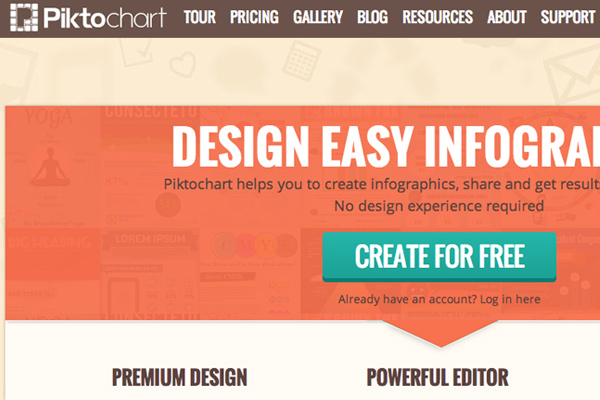
First up we have Piktochart which is an online webapp for creating infographics. The website is seriously fantastic and it provides a lot of staple features you would expect such as templates and graphic icons. There are some other premium account plans which offer better templates and no watermark branding.
However when just getting started I think Piktochart is a fun application to play with. You can study how other designers are making charts in the user showcase. By practicing with some of your own ideas it can be really easy to generate quality infographics with a bit of practice.
easel.ly
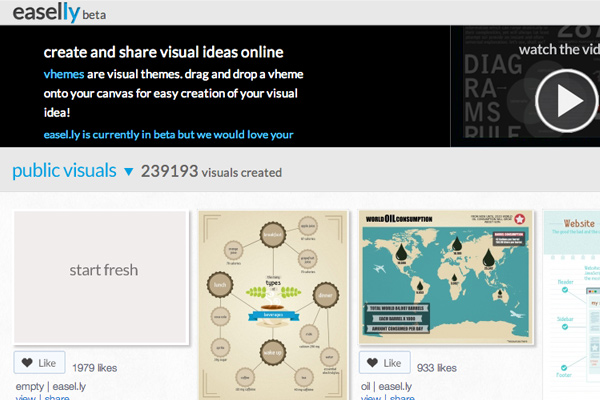
To compare another online infographics builder, the website Easelly is beautiful with its own full showcase gallery. Designers may publish their full infographics or templates onto the website and share them with the world. But you can also edit these infographic templates to setup any data formats you like! It is really easy and certainly the best tool for newbies.
My favorite part about Easel.ly is the large user-contributed showcase. This contains many template files which you can revamp to look like your own custom infographic. But there are also many fully-completed GUI sets which are submitted for inspiration. Their online visual editor tools are not difficult and they grow on you quickly, with a bit of practice. Plus you can get started without even signing up for an account.
Infogram
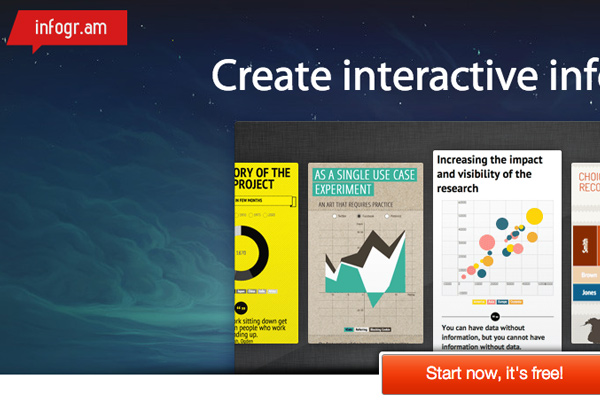
The new startup Infogram provides another beautiful interface to mockup your own infographics online. The website is currently in beta, yet does allow for open signups from anyone. There are a number of pre-formatted templates which you can build upon.
Also you can organize creations into various libraries for sharing. With a pro plan you can even download infographics as full PNG/PDF files. Infogram comes across like a more advanced web application for designers who want a premier infographics editing suite. The pro plan runs at $18/month or $180/year which may not be feasible for everyone. But even their free online editor is worth playing around to see what kind of tools are at your disposal.
Visually
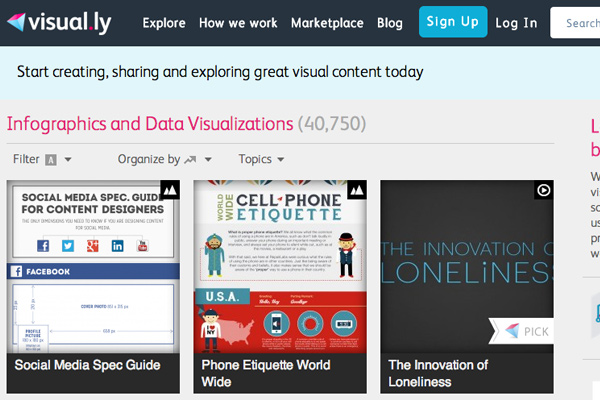
What infographics resource article could be complete without mentioning Visually? This site has grown very quickly to include a number of dedicated members who design, gather data, and publish content online. Visually isn’t just a sharing network for data visualisations. It is a meeting ground where you can work with others to create your own infographics.
The website has a marvelous online gallery which includes hundreds if not thousands of different examples. These infographics are often shared elsewhere on the web, but get republished into Visually as an archive. It can be fun going through all the categories to see what designers have created.
But as I mentioned earlier, Visually really offers some quality services for creating infographics. You do not need to be a designer or a researcher to put together all the sources. Check out the Visually marketplace for some detailed price guidelines. Even smaller projects may end up costing over $1,000 so it’s not exactly cheap, but glossing over their past examples it is safe to assume you will get what you pay for.
Vizualize.me
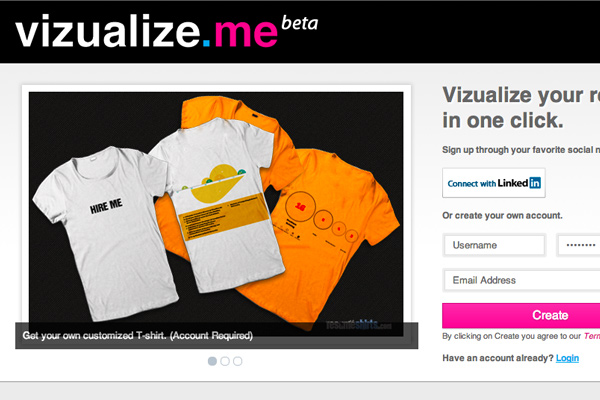
Here we have another web application in beta called Vizualize.me. The site is dedicated more towards online resumes than infographics. But the design styles are formatted just like you would expect to see in an infographic – stats, organized data, charts, and other such graphical elements.
I think Vizualize is opening into a new market which hasn’t really been needed until recently. Resume’s have usually been created in a word processor with static text. It is only recently with the popularity of the Internet have we seen a rise in graphically-enhanced resumes. The site is still very small but it’s growing fast, and certainly worth paying attention to see what else the team has planned for the future.
Freebie Resources
Along with these online web applications it is worthwhile to mention some freebies you can download. All of these resources are PSD or AI files which contain infographic templates & common interface items. The GUI kits are fantastic because you can play with shapes and graphs to learn how you might design your own.
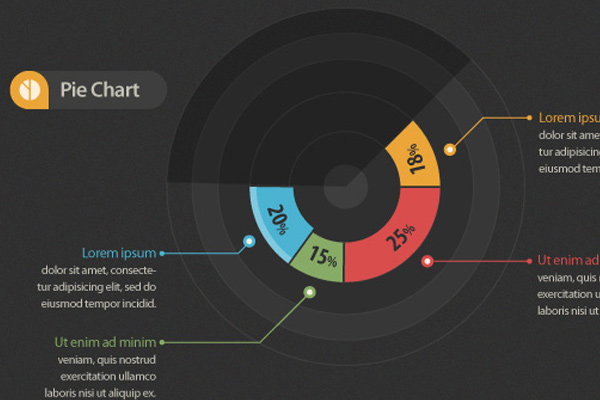
Infographic Vector Elements
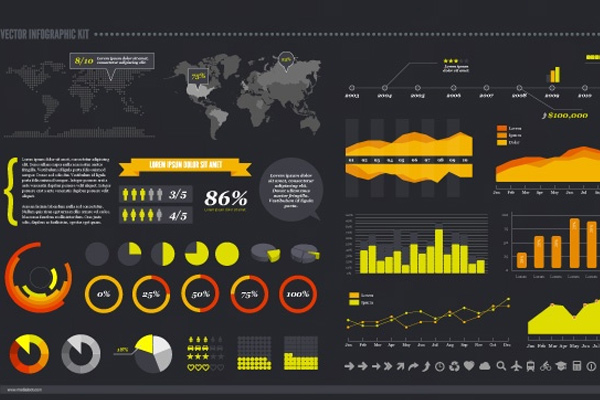
MediaLoot Vector Infographic Kit
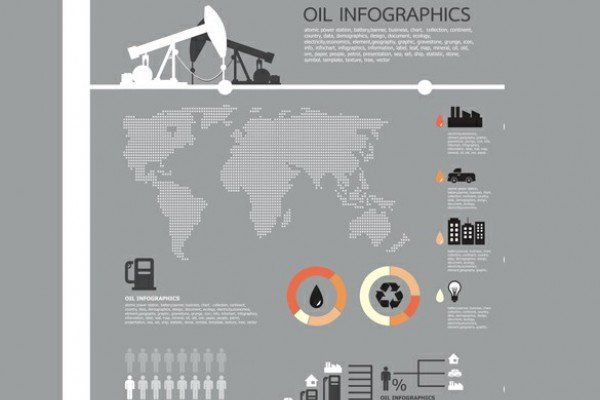
Oil Theme Business Infographic Vector
Elements of Food Infographics Vector
Closing
There are likely many other freebies to be found elsewhere online. This collection is a great way to get started practicing your own ideas with other designer’s GUI kits. I would highly recommend skimming the other resources listed here since most are devoted to online infographic design. Also if you know of similar resources I may have missed, please feel free to share with us in the post discussion area below.
The post Tools & Webapps for Creating your own Infographics appeared first on webdesignledger